Antibody validation Practical guide to finding and validating suitable antibodies for research
Positive and negative controls for antibody validation
Your positive control should confirm that your target antigen is expressed on the relevant cells and tissues. Your negative control should consist of tissues or cells where your target protein is known to be absent. You should always use several positive and negative controls at the same time. If possible, you should confirm the expression of the required target molecule in your sample using more than one assay.
What can you use as a positive and negative control?
a. Cell lines and tissues. Cell lines that endogenously express lack the protein of interest are widely used as controls in antibody validation (Example 1 and Example 2). Although the use of cell lines can be a valuable indicator of the expression of the target protein, the use of positive and negative control tissue(s) is essential for the full validation of the antibody and the assessment of non-specific binding (Example 3). Protein expression data may not, however, be available for many target antigens. Cells or tissues over-expressing or lacking mRNA encoding the relevant antigens should be used as controls in this situation.
Example 1
Validation of a monoclonal antibody (clone name LT19) raised against CD19 in cells known to express the endogenous target protein.
A collection of several lymphoma or leukaemia-derived cell lines of different lineages (T, B cells and myeloid cells) was stained with the mAb LT19 using flow cytometry. RAJI was used as a positive control while the JURKAT and U937 cell represented the negative control. The reactivity of the antibody was also tested on normal peripheral blood lymphocytes.

Figure legend Validation studies of a CD19 monoclonal antibody LT19 with flow cytometry using A) the Raji (Burkitt’s lymphoma cell), B) the JURKAT (T cell lymphoma) C) U937 (monocytic) cell lines and D) normal PBLs. Cells were incubated with antibody LT19 followed by anti-mouse labelled with PE. Negative control staining versus reactivity with the mAbs is shown in each histogram. The percentage of positive cells and mean fluorescence intensity (MFI) are indicated. Of the cell lines, only the RAJI Burkitt’s lymphoma derived B-cell line was stained by this monoclonal antibody. No labelling was observed of the JURKAT and U937 cell lines. D) shows antibody LT19 labelling 19% of peripheral blood lymphocytes, a population consistent with the numbers of B-cell lymphocytes in blood.
Example 2
Validation of the anti PRDM1 (clone name ROS) monoclonal antibody using myeloma cell lines.
Several human myeloma cell lines expected to express the PRDM1α protein were tested with antibody ROS using a combination of Western blotting and immunohistochemistry (IHC). The RAJI (Burkitt′s lymphoma) cell line was used as a negative control.

Figure legend Validation of the monoclonal antibody ROS for the PRDM1 protein using a combination of Western blotting and IHC. (A) Western blot analysis of PRDM1 expression in total protein extracts from multiple myeloma and RAJI cell lines. All the myeloma cell lines show a 97 kDa band, corresponding to the PRDM1α protein. The myeloma cell lines, SK-MM-2, KARPAS-620, NCI-H929, OPM-2 and LP-1, also expressed the 80 kDa PRDM1β protein. The negative control Burkitt´s lymphoma cell line, RAJI, expressed neither PRDM1α nor PRDM1β proteins. (B) PRDM1α nuclei staining in the cell lines correlated with the pattern of protein expression found by Western blotting.
Example 3
Validation studies of the anti PD-1 (clone name NAT105) monoclonal antibody using a tissue microarray.
Tissue Microarray (TA) technology was used to prepare a paraffin embedded block containing the cores from several deliberately chosen formalin-fixed paraffin-embedded normal tissue samples. This specially designed TA contained lymph node, thymus, spleen and tonsil (positive control tissues known to express PD-1) and kidney, heart, brain, placenta (negative control tissues lacking PD-1 protein). The use of such a TA enabled the reactivity of the NAT105 antibody to be tested using immunohistochemical labelling on a single glass slide. Testing different antibodies recognising against the same target in parallel and observing any common patterns of antibody reactivity can significantly strengthen confidence in the validation data generated. Therefore the reactivity of the antibody NAT105 on the TA was studied alongside another anti-PD-1 (a polyclonal antibody from R&D).
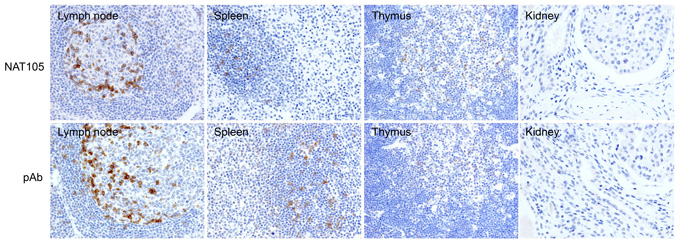
Figure legend Validation of NAT 105 monoclonal antibody in human tissue samples using immunoperoxidase labelling. Top row: Antibody NAT105 labelled both the membrane and nuclei of a small number of germinal centres cells in lymph node. Only a few weakly positive cells were present in the interfollicular T-cell zones. In the spleen, scattered NAT105-positive cells were present in the germinal center of the white pulp while only a few positive cells were detected in the thymic medulla. No labelling was detected in the kidney (negative control). Bottom row: This row shows a comparable pattern of staining with the polyclonal antibody to PD-1 from R&D and provides additional support for the specificity of antibody NAT105 for PD-1. polyclonal antibody. Both results support antibody specificity.
b. Transfected cells. Transfected cells (usually of mammalian origin and easy to transfect cells such as COS-7 or HEK293T cell lines) expressing your -target antigen are valuable tools (Example 4). Cells transfected with cDNA encoding the vector and the target antigen should be used as positive controls while negative controls should consist of cells transfected with the empty vector only. An important point here is to check that these cells do not endogenously express the target transcript/protein (and/or a highly related protein that might be cross reactive with the mAb) in high amounts before embarking on the transfection experiment. It is also important to be able to confirm that your transfection has worked and that your protein is being expressed. This can be investigated by using a properly validated antibody that has been shown to be specific for the target antigen. If the target recombinant protein cannot be detected with any existing validated antibodies, then it is worth considering epitope tagging your protein. Alternatively an expression plasmid that co-expresses a marker such as GFP, HA, MYC, V5 etc can be used (Example 5). Some proteins can also be difficult to overexpress and it may be necessary to include proteasome inhibitors in the culture medium to increase the stability or optimise codon usage thus improving the translation of the target protein.
Be careful! It is also key to appreciate that both polyclonal and monoclonal antibodies that can recognize the recombinant proteins in transfected cells may still be unable to detect the native endogenously expressed protein and thus this must also be confirmed independently. Conversely there are also rare examples where monoclonal antibodies can recognize the endogenous protein but not the recombinant antigen (usually a result of post-translational modifications etc).
Example 4
Validation studies of an anti-CD19 monoclonal antibody.
Flow cytometry validation studies on the antibody LT19 were performed using COS cells transiently transfected with cDNA encoding CD19. COS cells transfected with vector only were used as a negative control.

Figure legend Validation studies of the anti-CD19 monoclonal antibody (clone LT19) by flow cytometry A) CD19 COS transfectants and B) vector only transfectants. Cells were incubated with mAb LT19 followed by anti-mouse labelled with PE. Negative control staining versus reactivity with the mAbs is shown in each histogram. The percentage of positive cells and mean fluorescence intensity (MFI) are indicated. It can be seen from A) that antibody LT19 recognised 97% of the CD19 COS transfectants only 8% cells of the negative control COS cells were labelled thus supporting the specificity of this reagent for CD19.
Example 5
Validation studies using an epitope tag to demonstrate target protein expression in transfectants.
The NF1A monoclonal antibody was generated by immunisation with the mNANOG protein. The NF1A antibody was then studied using immunoperoxidase labelling on frozen cytospin preparations of V5-tagged-mNANOG HEK293T transfectants. A commercially available anti-V5 monoclonal antibody was used on these transfectants to confirm that a successful transfection (positive control). Fgfr1-V5 transfected HEK293T cells were used as a negative control.

Figure legend Immunoperoxidase staining of cytospins of HEK293T transfectants. A) The NF1A antibody labelled the nuclei (brown) in a subpopulation of V5-tagged mNANOG HEK293T transfectants. B) A similar number of stained cells was observed using the anti-V5 antibody. Besides confirming a successful transfection, this also provides information on the transfection efficiency (frequency of brown positivity) and the subcellular localisation of mNANOG. C) The absence of labelling with NF1A in the v5-tagged Fgfr1 transfectants (negative control) indicates that NF1A did not recognise the V5 tag. D) The use of anti-V5 confirmed the successful transfection using v5-tagged Fgfr1 of another negative control used in this experiment and provided additional information on the cytoplasmic/membrane subcellular localisation of the Fgfr1-V5 protein.
c. Controls with different levels of protein expression. Choosing positive controls expressing different levels of protein expression for your target antigen, e.g. strong versus moderate/weak, can also be used for antibody validation and their use can add confidence in the antibody specificity. Such controls also help identify those antibodies with the highest affinity for the target antigen (Example 6 and Example 7).
Example 6
Further validation of the anti-Nanog (clone NF1A) monoclonal antibody using a transgenic mouse model.
The expression of Nanog was induced for 72 hours using tetracycline (TetON system) in Nanog transgenic mice. Sections of liver from the mice subjected to varying doses of tetracycline were then stained by antibody NF1A in IHC studies.
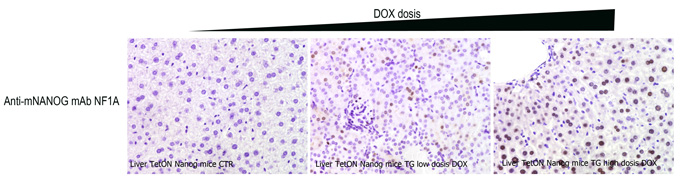
Figure legend Immunoperoxidase labelling studies using the NANOG monoclonal antibody NF1A on liver sections prepared from Nanog transgenic mice. Negligible labelling was observed in the CTR or the Nanog-overexpressing (TG) mice in the absence of tetracycline. Increasing levels of staining were, however, detected as the concentration of tetracycline in the drinking water increased from 0.2 mg ml−1 (Lo) to 2 mg ml−1 (Hi) supporting the specificity of the antibody.
Example 7
Validation studies of a mouse monoclonal antibody (clone JOR110A) to murine serum amyloid A3 (Saa3) using the in-vitro induction of the target antigen.
Murine serum amyloid A3 (Saa3) is a high density apolipoprotein secreted by macrophages. To confirm the antibody specificity of the Saa3 mAb supernatant from the RAW12 cell line stimulated with LPS 1ug/ml after 8, 12, 16 and 24 hours as reported in the attached article (http://www.pnas.org/content/89/17/7949.long) was collected and concentrated. Supernatant from unstimulated cells was used as a negative control. The supernatants were studied in Western blotting studies with the anti-Saa3 mouse monclonal antibody JOR110A.
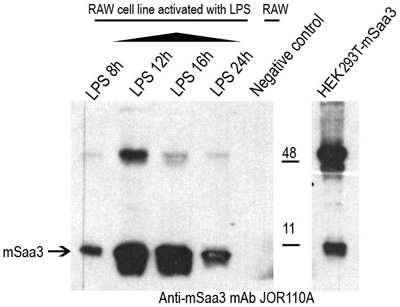
Figure legend Western blotting studies of JOR110A, the anti-Saa3 murine monoclonal antibody, with supernatants from the Saa3 secreting RAW12 cell line. A specific band of 13kDa was detected in all of the LPS activated RAW12 cell lines. The highest levels were present after 12 and 16 hour LPS stimulation. No murine Saa3 protein was detected in the concentrated supernatant from the unstimulated RAW12 cell line (negative control). The HEK-Saa3-Gfp cell extract was used as a positive control.
d. Knockout (KO) mice. Wild-type mice and mice in which the antigen of interest has been eliminated by transgenic engineering can be used to help to validate antibody specificity and can be the best negative control (Example 8 and Example 9). Alternatively, primary cells or cell lines derived from KO mice can also be used.
Be careful! Unfortunately the use of KO mice is only applicable if your antibody recognizes a mouse molecule. In addition, the numbers of different types of KO mice available are quite limited at present. Furthermore, there are instances when cross-reactivity (particularly with a highly related protein) cannot be detected in a single gene KO model. One explanation for this is that knocking out one gene that regulates the expression of another may, functionally, create a double knockout. Also in some cases, even if the gene has been knocked out, there may still be expression of a portion of the protein encoded by the gene and the antibody undergoing validation may recognise this partial protein product. An instance of this where the estrogen receptor alpha may not be completely knocked out is shown in Example 7. In such a situation it is therefore essential to obtain the full details of the strategy used to generate the KO animal and use an alternative method to validate your antibody.
Example 8
Validation studies using tissues from a knock out mouse for validating antibody specificity to the estrogen receptor.
The specificity of the anti-estrogen receptor (clone name CRET 94D) monoclonal antibody was tested on ovarian tissue samples obtained from wild type (WT) and knock-out (KO) mice lacking either the beta or alpha subunits of the estrogen receptor. Immunoperoxidase labelling was carried out on paraffin tissue sections while Western blotting was performed using ovarian tissue extracts from the WT and KO mice.

Figure legend Immunohistochemical labelling and Western blotting studies to study the specificity of the specificity of the CRET 94D monoclonal antibody. A) The antibody CRET 94D gave strong nuclear labelling (brown) in paraffin sections of ovarian tissue from WT and estrogen beta receptor KO mice. In contrast, weak labelling of ovarian tissue was observed in the ovarian tissue from the estrogen receptor alpha KO mouse. These results demonstrating the specificity of the CRET94D antibody for the estrogen alpha subunit were confirmed by Western blotting studies. B) A specific 66kDa band was observed in both the WT and estrogen beta receptor KO uterus cell extracts. Note that a faint 66kDa was observed in the estrogen receptor alpha KO cell extract, a result suggestive that, despite its KO, there may still be a small portion of the estrogen receptor alpha that is still expressed and is recognised by the antibody (a situation described above).
Example 9
Validation studies using isolated cells from a CD229 deficient mouse to test the specificity of the murine monoclonal antibody clone mLy9.10.33.
If available, then cells or tissues from a KO-mice can be used to further validate an antibody. Thymocytes, which all express the surface Cd229 molecule, were isolated from wild type and Cd229 KO mice were isolated. These cells were then analysed by flow cytometry using the antibody mLy9.10.33.

Figure legend Validation studies of a CD229 monoclonal antibody with flow cytometry using cells from a KO-mice. Cells were incubated with mAb mLy9. 10.33 followed by anti-mouse labelled with PE. Negative control staining versus reactivity with the mAbs is shown in each histogram. Percentage of positive cells and mean fluorescence intensity (MFI) are indicated. (A) Negligible labelling (3.6%) was observed on thymocytes obtained from the Cd229 KO mouse (A). In contrast in (B) 81.6% of the thymocytes from the wild type mice were labelled with the antibody mLy9.10.33 thus supporting its specificity for CD229.
e. siRNA. Carefully planned siRNA experiments involving the specific knockdown of protein expression, resulting in the absence or decrease of the specific target protein relative to controls, is another useful tool for antibody validation (Example 10).
Be careful! Unfortunately, not all cell types are easily manipulated by siRNA and some may require the lengthy optimization of the experimental protocols. Furthermore, depending on the nature of the mRNA and protein turnover rate, some targets are not affected by siRNA, the effect of which can only be maintained transiently for several days. Also the region targeted is very small and thus silencing may not affect all isoforms of the antigens that are derived from alternatively spliced transcripts. Moreover, in some cases non-specific reductions in the expression of several proteins have been observed due to ‘off target’ effects mediated by a siRNA binding to other transcripts that share a common ‘seed’ region. It is therefore desirable in many instances to show silencing with more than a single siRNA and to design these to bind to different regions of the target transcript.
Example 10
The use of siRNA for antibody validation of commercially available rabbit monoclonal antibodies for the TAK1 protein
TAK1 RNA interference (siRNA) was performed to investigate the specificity of two commercially rabbit monoclonal antibodies to the TAK1 protein. The NTC cell line was treated with 25nM, 50nM or 100nM of TAK1 siRNA for 24h, 48h or 72h. The untreated cell line and those cells treated with a non-targeting siRNA were used as negative controls. The expression of TAK1 protein in the cell lysates was then studied using Western blotting. The cell samples were also analyzed using quantitative PCR to independently confirm the transcript silencing of the TAK1 gene.

Figure legend TAK1 siRNA silencing to investigate the specificity of two different rabbit monoclonal antibodies (from Cell Signaling and Abcam) using Western blotting and quantitative PCR techniques. A) Western blotting showed decreased labelling of the TAK1 protein by the Cell Signaling monoclonal TAK1 in the TAK1 siRNA treated NTC cell extracts. TAK1 protein levels were unaltered in the control cells that had either been treated with a non-targeting siRNA or left untreated. These results supported the specificity of this antibody for TAK1. B) In contrast, this decrease was not observed with the Abcam monoclonal antibody. Instead this monoclonal antibody recognised a double band in all the cell extracts, even those from untreated cells and those treated with non-targeting siRNA. β-actin was included as a loading control and shows comparable protein levels were present in all extracts in A) and B). C) The results from quantitative PCR studies confirmed the significant knockdown of TAK1 transcripts in TAK1 siRNA treated samples at all-time points and siRNA concentrations compared to the non-targeting siRNA and untreated controls.
f. CRISPER/Cas9. Knock-out (KO) using CRISPR/Cas9 technology is a robust technique used to confirm antibody specificity by testing the Ab of interest in a KO cell line. This KO validation uses CRISPR’s guide RNA (gRNA) to direct the Cas9 endonuclease to the gene of interest through sequence-specific targeting, producing double-stranded breaks around targeted sites. The resulting DNA cleavage results in knockout of the target gene. Testing your Ab in a specific application, e.g. Western blotting, immunohistochemistry, should result in the absence of signal in a KO cell line while giving the specific target protein signal in the wild-type (WT) cell line (see Example 11).
Be careful! One disadvantage of knockout methods is that, as they alter the DNA to prevent the target protein ever being expressed, there is a risk of cell death if that protein is essential for cell survival.
Example 11
Validation studies using a cell line before and after TOX gene inactivation using CRISPR-Cas9 technology
The specificity of the NAN448B mAb for the endogenous TOX protein was confirmed by Western blotting and flow cytometry using a cell extract of the MOLT4 cell line before and after TOX gene inactivation using CRISPR-Cas9 technology.

Figure legend TOX mAb validation using CRISPR/Cas9 technology A) Western blotting validation of TOX (NAN448B) mAb using a cell extract of MOLT4 cell line before and after TOX gene inactivation. In the (WT) MOLT4 cell line two specific bands around 63 kDa and 57kDa were detected. Neither band was found in the MOLT4 cell extract after TOX depletion (MOLT KO TOX). B) Flow cytometry using a MOLT4 cell line before and after TOX gene inactivation (MOLT4 KO TOX in blue and MOLT4 WT in red). Both results confirm the specificity of NAM448B for TOX protein.
g. Xenografts. Xenografts generated from cell lines with known target expression levels are a valuable tool to verify target specificity. Furthermore, when combined with a previously characterized drug treatment, these models can be used to show target modulation upon treatment.